
Research and applied student projects have led to several data collection tools, evaluation, and datasets that are freely available and ready to be used or adapted in practice, including:
- US Shared Micromobility Equity Dashboard
- Shared Micromobility Equity Evaluation Tool
- Shared Micromobility Parking Data Collection Tool
- Bike Rack Inventory Data Collection Tool
- Sidewalk Condition and Street Crossing Treatment Data Collection Tool
- Bike Lane Count Data Collection Tool
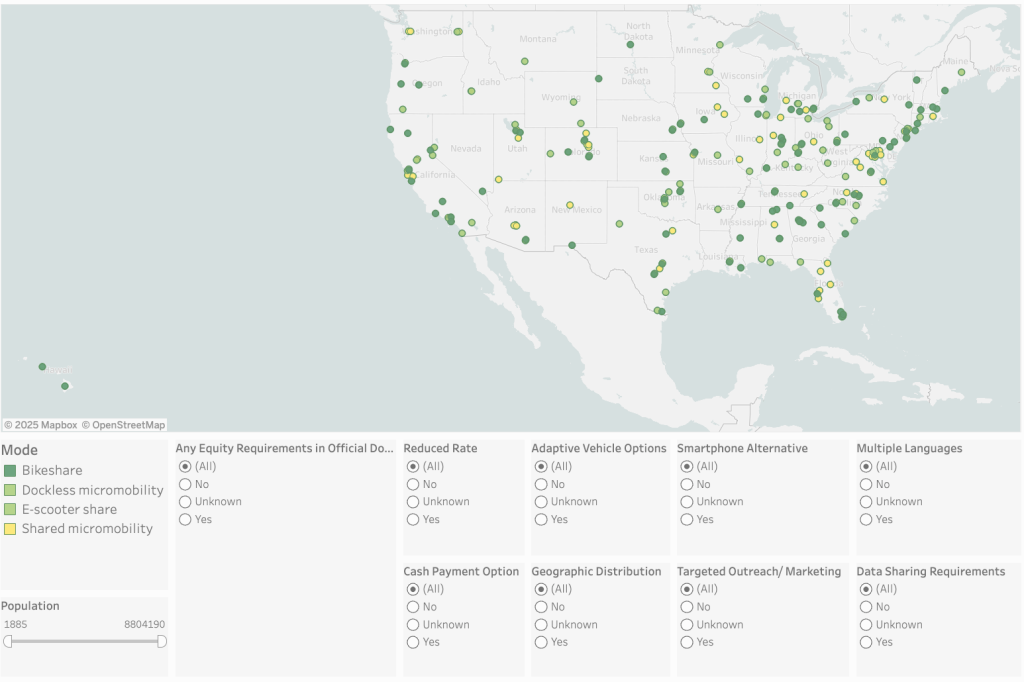
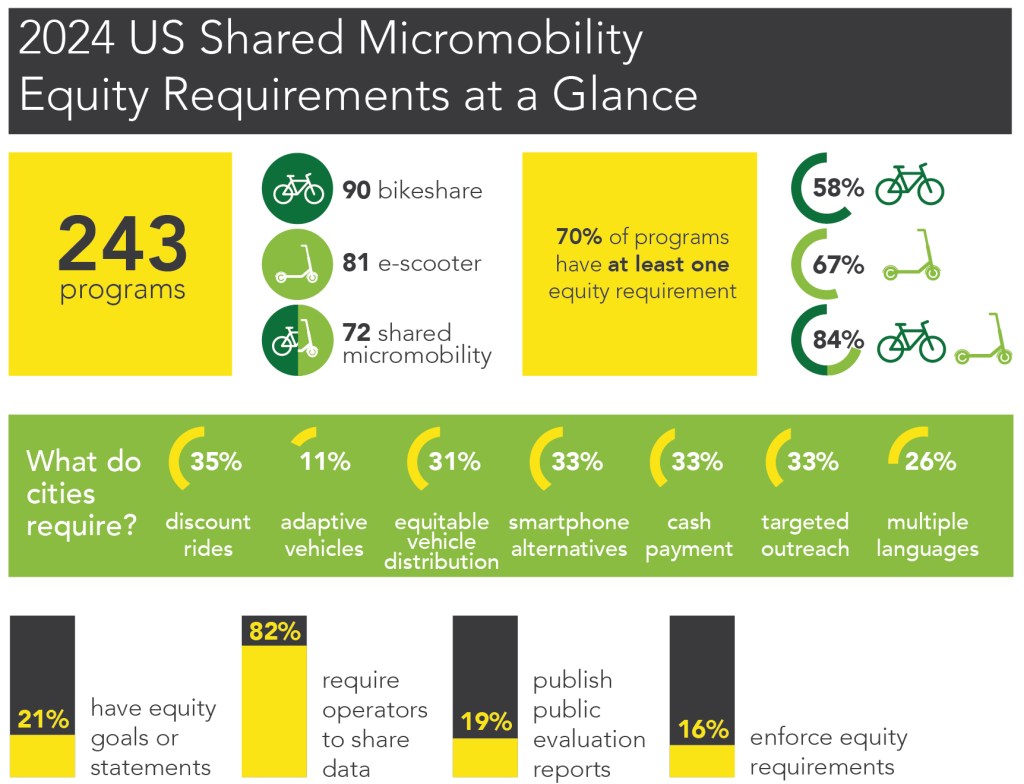
US Shared Micromobility Equity Dashboard
Alex Staben, Caroline DeBruine, Anne Brown, Amanda Howell, and Zoe Green
Read the research behind this tool: Mobility for the People, Equity Requirements in US Shared Micromobility Programs; Equity Requirements in US Micromobility Programs are on the Rise; From Paper to Practice, Shared Micromobility Equity Requirements Yield Mixed Outcomes
Shared Micromobility Equity Evaluation Tool
Anne Brown, Amanda Howell
Purpose
The purpose of this evaluation tool is to help you determine the strength of the connections between your program goals, design, and evaluation metrics, and identify where there are opportunities for growth.
Who should use this tool?
The target audience for this tool is city staff engaged in managing, designing, or operating shared micromobility services.
Using the Tool
This tool evaluates equity across three dimensions:
- Process (targeted marketing and outreach)
- Implementation (social and spatial)
- Evaluation (data sharing requirements, enforcement related to equity, and evaluation report)
We estimate that the evaluation will take between 20 and 45 minutes to complete. You can save your progress and return to the evaluation at a later time if needed.
After completing the evaluation, you will be emailed customized scores reflecting your program’s strengths and opportunities for growth across three dimensions of equity: Process, Implementation, and Evaluation. You will also receive a resource guide that points to promising approaches you might consider as you continue to iterate existing programs and/or launch new ones.
Shared Micromobility Parking Data Collection Tool
Nicholas J. Klein and Calvin Thigpen
Want to see how shared bikes, e-scooters, or cars are parked on your block or in your city? These data collection materials were originally designed to evaluate how different vehicles or objects blocked sidewalk access according to Americans with Disability Acts standards. They can be adapted to other contexts or needs and data can be collected either digitally or in paper form.
Read the research behind this tool: Frequency and characteristics of improper scooter, bike, and car parking; Scooter parking interventions and perceptions; Testing scooter parking designs
Bike Rack Inventory Data Collection Tool
This data collection tool was developed to document the types and locations of bike rack infrastructure in Eugene, OR. The methods can be easily adapted to other contexts. The tool used in this research used Survey123, which is a proprietary ESRI platform. Other ESRI platforms or open access data collection tools could also be used.
University of Oregon Anne Brown, Josh Kashinsky, Marc Schlossberg | City of Eugene Shane Rhodes | Lane Council of Governments Ellen Currier | Peace Health Rides Al Hongo, Brodie Hylton.
Student collaborators: Ben Bedard, Porter Colville, Sadie Creemer, Claressa Davis, McClean Gonzalez, Kaitlyn Halpin, Payton Jones, Josh Kashinsky, Josh Kubu, Jacob Loomis, Sierra Marshall, Matt McCreary, Abby McFeeters-Krone, Jacob Roth, Kathleen Sullivan, and Katelyn Wells
Sidewalk Condition and Street Crossing Treatment Data Collection Tool
Sidewalks are critical links in our transportation system, but often cities don’t know what condition they’re in, what, or where issues exist. These data collection tools provide guidance on what’s most important to measure and data collection materials guided by Americans with Disability Act sidewalk regulations. Materials include data collection and guidance for both sidewalk condition and quality as well as crossing treatments (e.g., marked crosswalks, pedestrian beacons, etc.).
Student collaborators: Chris Skawski, Jacob Roth, Aidan Austin, Rae Grant, Matt McCreary, Sierra Rodriguez, Blaire West, Lily Herran, Mack Gray, Ben Bedard, Braden Ravenscraft, Cory Frost, Porter Coleville, and Alex Alonso, Jordan Rhorer, and Amena Martinez-Smith.
Bike Lane Count Data Collection Tool
Want to know how many people use your city’s bike lane(s) and how they use them (do they turn or go straight, do they stop at red lights?). Plus, what’s the experience like riding a corridor as a cyclist? These two data collection sheets provide templates for field data collection. They were designed for evaluating the 13th Avenue Bikeway in Eugene, OR. You can also read the report generated using data collected by these forms as examples of how you can use the data to better understand bikeway use and experiences.
